
VChart 如何实现类似 ECharts 的 profile 效果?
问题描述
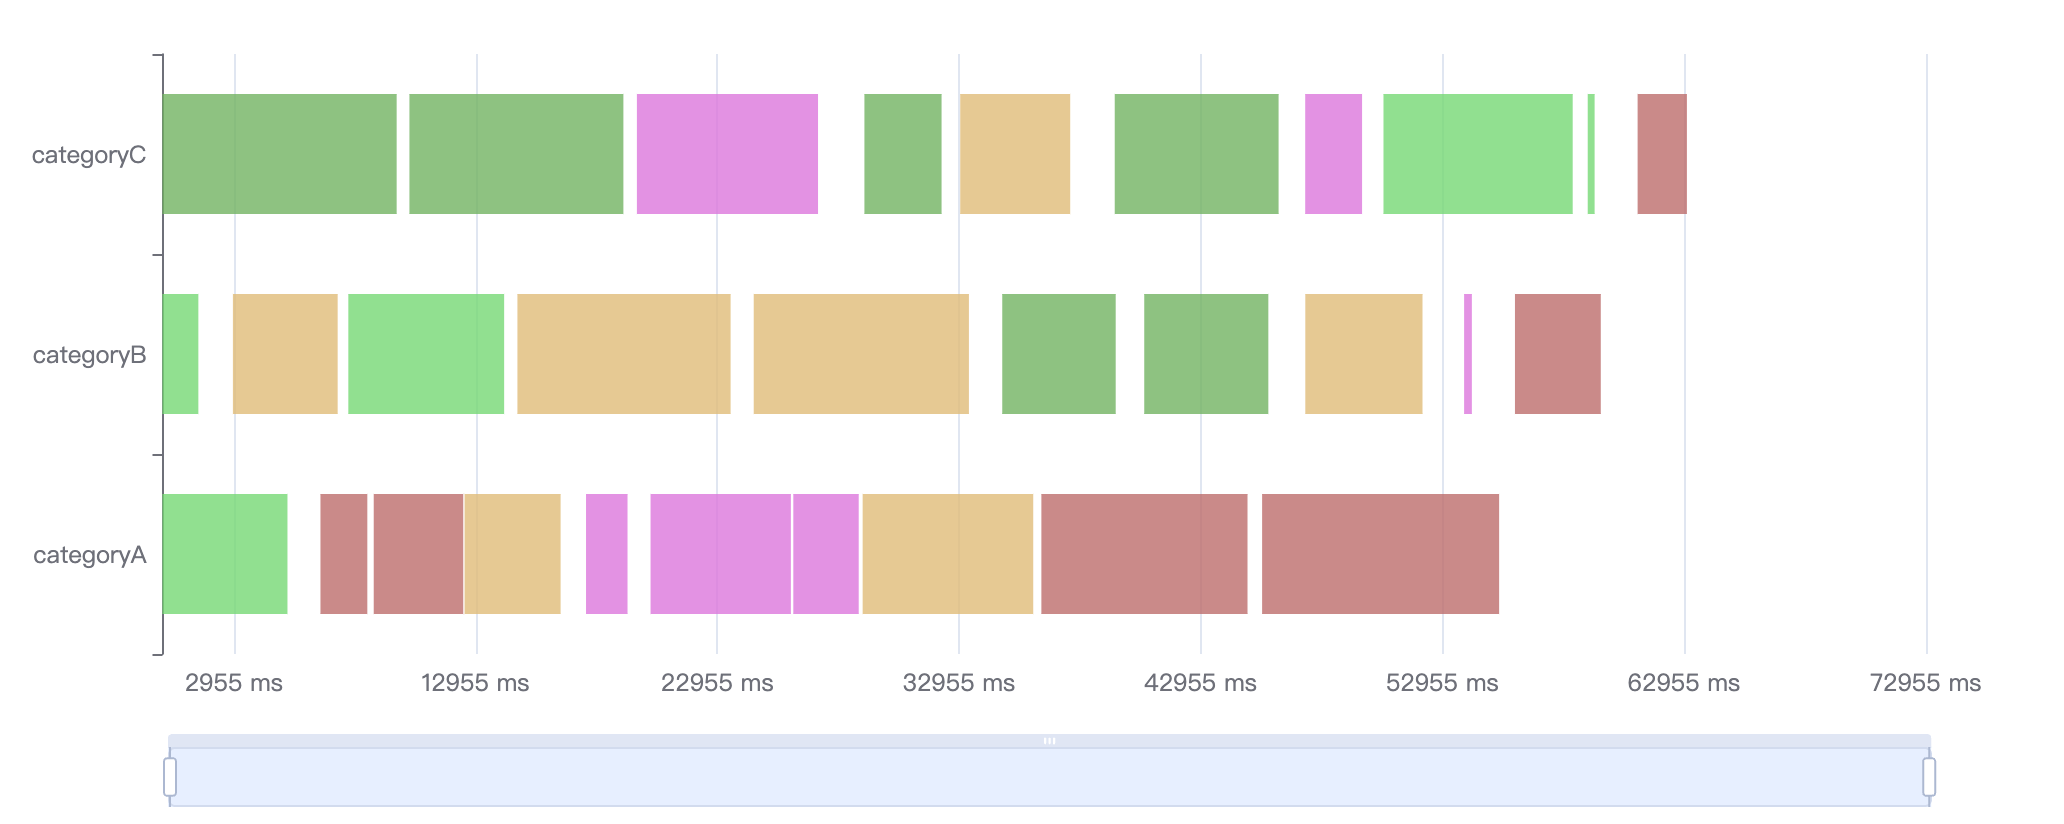
类似 (https://echarts.apache.org/examples/zh/editor.html?c=custom-profile)这样的图表,VChart如何配置支持?
解决方案
不同图表库的解决方案不一样,根据你给的 demo,在 VChart 中只需要配置区间柱状图(rangeColumn 类型)即可。
代码示例
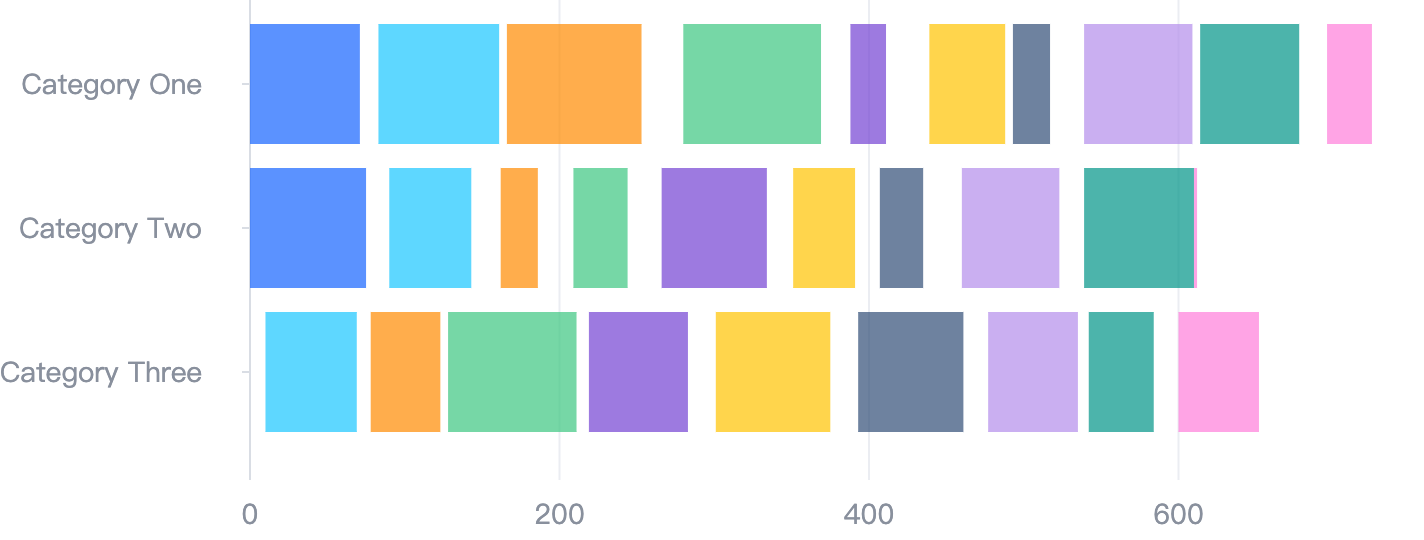
const values = [
  { type: 'Category One', min: 0, max: 71, group: 0 },
  { type: 'Category One', min: 83, max: 161, group: 1 },
  { type: 'Category One', min: 166, max: 253, group: 2 },
  { type: 'Category One', min: 280, max: 369, group: 3 },
  { type: 'Category One', min: 388, max: 411, group: 4 },
  { type: 'Category One', min: 439, max: 488, group: 5 },
  { type: 'Category One', min: 493, max: 517, group: 6 },
  { type: 'Category One', min: 539, max: 609, group: 7 },
  { type: 'Category One', min: 614, max: 678, group: 8 },
  { type: 'Category One', min: 696, max: 725, group: 9 },
  { type: 'Category Two', min: 0, max: 75, group: 0 },
  { type: 'Category Two', min: 90, max: 143, group: 1 },
  { type: 'Category Two', min: 162, max: 186, group: 2 },
  { type: 'Category Two', min: 209, max: 244, group: 3 },
  { type: 'Category Two', min: 266, max: 334, group: 4 },
  { type: 'Category Two', min: 351, max: 391, group: 5 },
  { type: 'Category Two', min: 407, max: 435, group: 6 },
  { type: 'Category Two', min: 460, max: 523, group: 7 },
  { type: 'Category Two', min: 539, max: 610, group: 8 },
  { type: 'Category Two', min: 610, max: 612, group: 9 },
  { type: 'Category Three', min: 0, max: 0, group: 0 },
  { type: 'Category Three', min: 10, max: 69, group: 1 },
  { type: 'Category Three', min: 78, max: 123, group: 2 },
  { type: 'Category Three', min: 128, max: 211, group: 3 },
  { type: 'Category Three', min: 219, max: 283, group: 4 },
  { type: 'Category Three', min: 301, max: 375, group: 5 },
  { type: 'Category Three', min: 393, max: 461, group: 6 },
  { type: 'Category Three', min: 477, max: 535, group: 7 },
  { type: 'Category Three', min: 542, max: 584, group: 8 },
  { type: 'Category Three', min: 600, max: 652, group: 9 }
];

const spec = {
  type: 'rangeColumn',
  data: [
    {
      id: 'data0',
      values
    }
  ],
  direction: 'horizontal',
  seriesField: 'group',
  yField: 'type',
  xField: ['min', 'max'],
  label: {
    visible: false
  },
  bar: {
    style: {
      height: 60
    }
  }
};
结果展示
在线效果参考:https://codesandbox.io/s/vchart-profile-6v2c2l
相关文档
rangeColumn 教程:https://visactor.io/vchart/guide/tutorial_docs/Chart_Types/RangeColumn 相关 api:https://visactor.io/vchart/option/rangeColumnChart#type github:https://github.com/VisActor/VChart